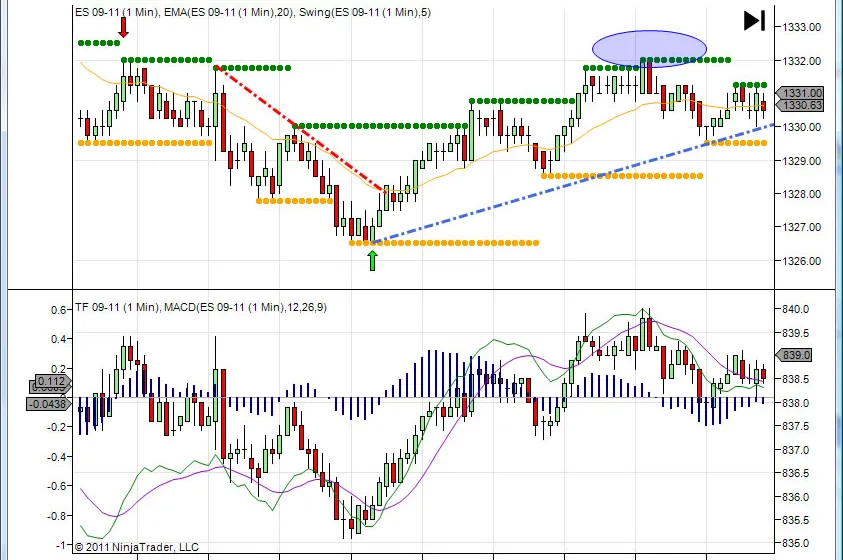
Technical analysis is the study of price, volume, and market behavior using charts and indicators. Traders use it to understand trend, momentum, volatility, support, resistance, and possible areas of interest.
Technical analysis does not remove risk or predict the future with certainty. Its value is in giving traders a structured way to define what they are looking for.
What an indicator actually does
A technical indicator transforms market data into a visual or numerical signal. That signal might be a moving average, oscillator, volatility band, volume study, divergence marker, or custom calculation.
The useful question is not whether an indicator is good or bad in isolation. The useful question is how the indicator fits into a specific workflow:
- Does it define context?
- Does it trigger an entry?
- Does it confirm another signal?
- Does it warn the trader to stay out?
- Does it help manage an open trade?
Once the role is clear, the indicator can be tested and, if needed, automated.
Common types of technical indicators
Trend indicators
Trend indicators help identify direction. Moving averages, directional movement tools, and regression-based studies are common examples. They can help traders avoid taking trades against the broader context.
Momentum indicators
Momentum indicators measure the speed or strength of a move. RSI, MACD, rate of change, and stochastic tools are common examples. Traders often use them to identify acceleration, exhaustion, or divergence.
Volatility indicators
Volatility indicators measure how much the market is moving. ATR, Bollinger Bands, Keltner Channels, and standard deviation tools can help define stops, targets, and whether the market is active enough for a strategy.
Volume and order-flow indicators
Volume tools help traders understand participation. Depending on the platform and data feed, this can include volume profile, delta, bid/ask volume, footprint-style displays, or custom order-flow calculations.
Support and resistance tools
Support and resistance tools mark price areas that may matter. These can include pivots, swing highs and lows, prior session levels, Fibonacci levels, volume nodes, or custom price zones.
Turning analysis into software
Technical analysis becomes easier to automate when the rules are explicit. For example, “RSI is low” is vague. “RSI crosses back above 30 after price closes above the prior bar high” is closer to something a developer can build and test.
If you want a custom indicator or strategy, document the exact conditions, screenshots, chart settings, and examples. The clearer the visual rule, the cleaner the software build.
When custom indicators make sense
Custom indicators make sense when native platform tools cannot express the workflow clearly, when multiple conditions need to be combined, or when alerts and automation require more precise logic.
A good custom indicator should make the trader’s process easier to see, test, and repeat. It should not add complexity for its own sake.