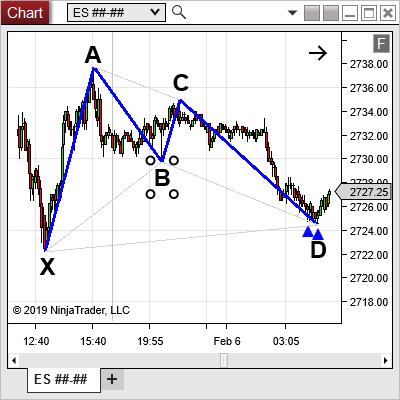
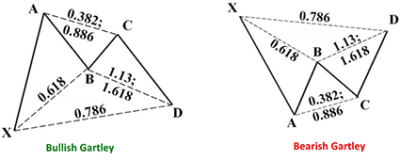
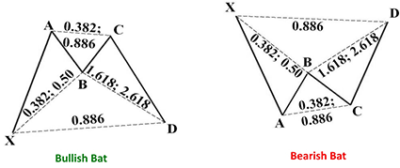
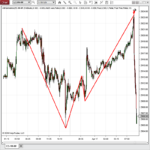
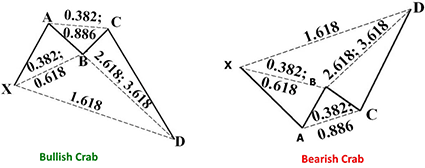
Harmonic patterns are formed when a sequence of run-ups and pullbacks in the market adhere to predefined ratios (typically Fibonacci ratios). Many traders use Harmonic patterns in an attempt to identify key turning points in the markets, as well as predictions on future market movement. As seen in the image below, Harmonic patterns are typically comprised of five swing highs and lows (Marked X, A, B, C, D in the image), which then form four “legs” (XA, AB, BC, CD). If the ratios between each of the legs adhere to the predefined ratios, a valid Harmonic pattern is formed.
Commonly Used Harmonic Patterns
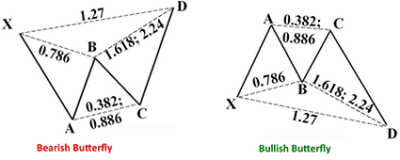
There are several types of harmonic patterns. Most harmonic patterns consist of legs, with the only difference being the ratios between the legs. Below is a list of some of the most common patterns, as well as the typical Fibonacci ratios used to identify them.
My Harmonic Pattern Indicator
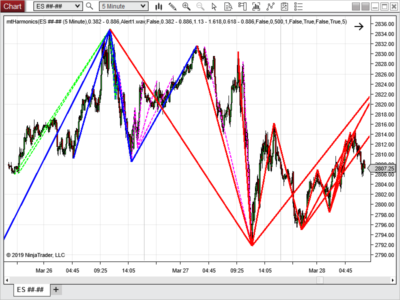
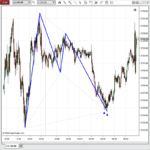
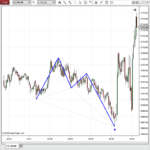
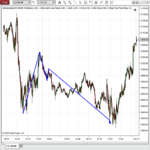
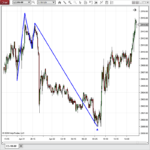
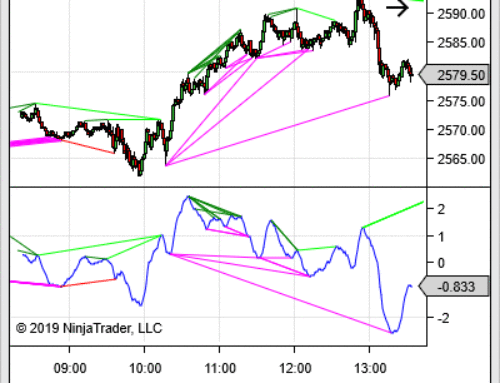
Harmonic patterns can be difficult to find manually. As seen in the image above, many patterns can be formed in a short time period, and patterns can exist within other patterns. Finding all of the possible legs and calculating the ratios between them takes a lot of time, which can result in missed trading opportunities. Our indicator will perform the calculations in just milliseconds, finding every pattern that meets the criteria.
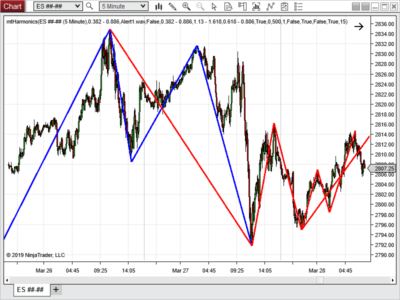
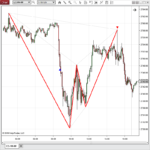
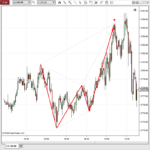
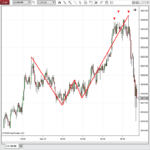
The previous image shows how many patterns the indicator is capable of finding. It is looking for patterns forming using some less significant high and low points. If we change a simple setting in the indicator to make it use more significant highs and lows, the indicator still finds many patterns, but the chart looks a lot cleaner. The image above shows the same chart using the more significant highs and lows.
Features
The indicator contains several parameters that allow user customization. Below are definitions for each parameter indicator.
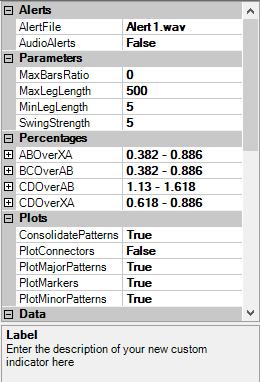
- AlertFile – .wav file used for audio alerts when patterns are found.
- AudioAlerts – allows the user to enable/disable audio alerts
- MaxBarsRatio – the longest leg (the one that spans the most bars) must be no more than this multiple of the shortest leg. This can be disabled by setting the value to 0.
- MaxLegLength – no leg in the pattern can span more bars than this amount.
- MinLegLength – no leg in the pattern can span less bars than this amount.
- SwingStrength – determines the significance of the swing highs and lows used to form each leg. When set to 5, each swing point must be a 5 bar high or low to be considered.
- ABOverXA – allows the user to modify the minimum and maximum percentages allowed for the AB/XA ratio.
- BCOverAB – allows the user to modify the minimum and maximum percentages allowed for the BC/AB ratio.
- CDOverAB – allows the user to modify the minimum and maximum percentages allowed for the CD/AB ratio.
- CDOverXA – allows the user to modify the minimum and maximum percentages allowed for the CD/XA ratio.
- ConsolidatePatterns – many times, the indicator will find patters that are almost identical. Plotting all of them on the chart can cause clutter. When set to true, this parameter will consolidate similar patterns and only plot the most significant one (the one that spans the most bars).
- PlotConnectors – determines whether the connector lines are plotted with the patterns.
- PlotMajorPatterns – determines whether Major patterns are plotted. Major patterns are defined as patterns where the swing high/low labeled ‘X’ is a higher high or lower low.
- PlotMarkers – determines whether the chart markers to show where patterns occurred are plotted
- PlotMinorPatterns – determines whether Minor patterns are plotted. Minor patterns are defined as patterns where the swing high/low labeled ‘x’ is a lower/equal high or higher/equal low.
No other products compare when it comes to detecting Harmonic patterns in NinjaTrader!

Buy It Now!!!
Purchase a LIFETIME LICENSE for only $199.95. Simply enter your NinjaTrader Machine ID and use the appropriate button below. NO REFUNDS, ALL SALES ARE FINAL!

Leave A Comment